STP and ETP systems are installed for treatment and compliance, but many sites still depend on manual logbooks for flow records. Operators write inlet and outlet readings, prepare daily reports, and escalate issues only when someone notices an abnormal value.
A digital flow monitoring system gives continuous visibility into treated water, effluent discharge, plant utilization, and abnormal operating conditions. This guide explains how to monitor STP/ETP flow using meters, Modbus, 4G telemetry, dashboards, and alerts.
Why STP/ETP flow monitoring matters
Flow monitoring is useful for both compliance and operations.
For compliance, it helps maintain records of:
- Inlet flow
- Outlet flow
- Treated water reuse
- Discharge volume
- Daily and monthly totals
- Zero-flow or bypass conditions
- Plant operating history
For operations, it helps identify:
- Underloaded or overloaded treatment systems
- Pump failures
- Blocked lines
- Unexpected discharge
- High inflow events
- Treatment plant downtime
- Reuse system performance
The same data that supports reporting also helps plant teams run the system better.
What should be monitored?
A practical STP/ETP monitoring system can include flow, level, quality, pump status, and telemetry health.
| Parameter | Why it matters |
|---|---|
| Inlet flow | Shows wastewater load entering the plant |
| Outlet flow | Shows treated/discharged water volume |
| Reuse flow | Tracks treated water reuse for gardening, flushing, process, etc. |
| Cumulative totalizer | Required for daily/monthly reporting |
| Pump status | Explains flow changes and runtime |
| Tank level | Prevents overflow or dry run |
| pH / TDS / turbidity / COD proxy, where applicable | Supports process visibility |
| Power status | Explains plant downtime |
| Gateway online status | Confirms telemetry health |
| Last data timestamp | Helps detect reporting gaps |
Not every site needs every parameter on day one. Flow and totalizer data are usually the best starting point.
Basic architecture
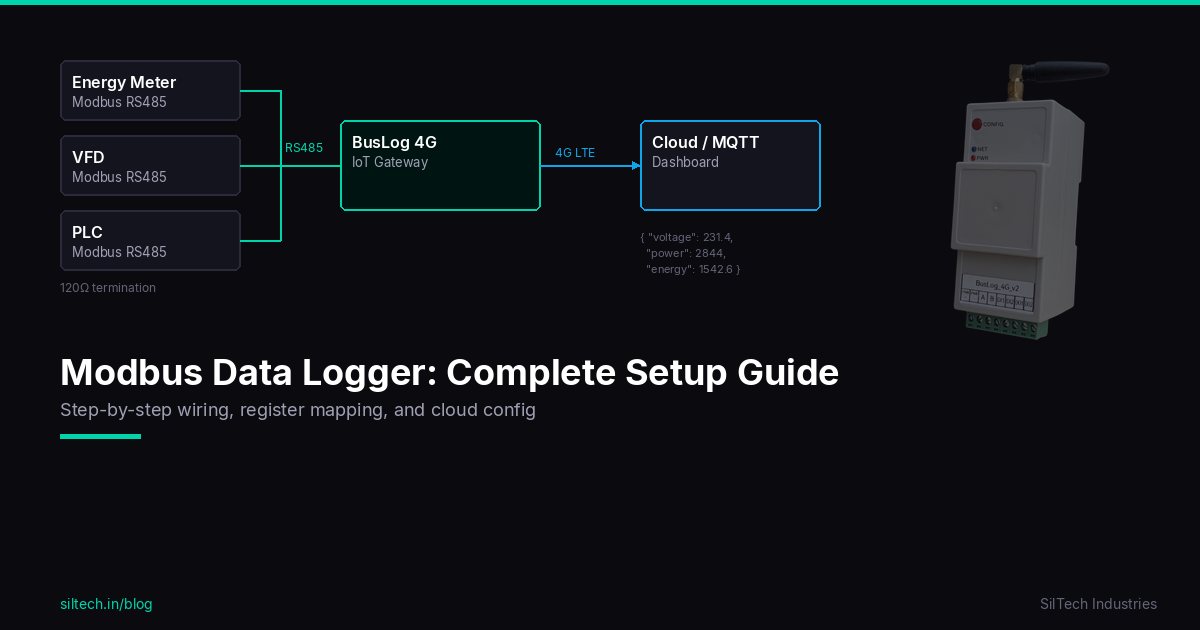
A standard STP/ETP telemetry system looks like this:
Flow Meter / Pump Status / Level Sensor / Analyzer
        ↓ Modbus RS485 / Digital Input / Analog Signal
Telemetry Gateway
        ↓ 4G LTE
Cloud Dashboard
        ↓
Reports + Alerts + Audit History
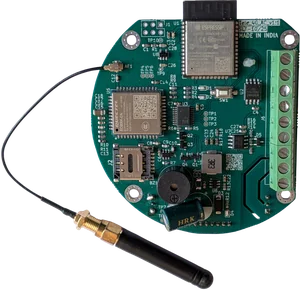
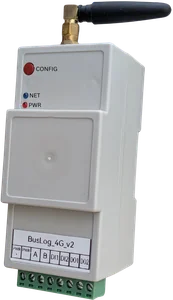
For flow-meter-focused deployments, Flow Telemetry 4G can be used. For broader plant monitoring with multiple meters or sensors, BusLog 4G is a better fit.
Choosing the flow meter
The flow meter should match the pipe, fluid, installation location, and reporting requirement.
Common choices:
- Electromagnetic flow meter for conductive wastewater
- Ultrasonic flow meter for non-invasive or clamp-on applications
- Open channel flow measurement for channels or drains
Important checks:
- Correct pipe size
- Proper straight length before and after meter
- Full-pipe condition where required
- Grounding as per manufacturer instructions
- Stable power supply
- Modbus RTU availability
- Totalizer register availability
- Calibration certificate and serial number record
For compliance-focused records, cumulative totalizer data is usually as important as live flow rate.
Inlet, outlet, and reuse flow
Many STP/ETP sites should monitor more than one point.
Inlet flow
Inlet flow shows how much wastewater is entering the treatment system. It helps identify high-load periods, unusual inflow, and plant underutilization.
Outlet flow
Outlet flow shows treated water discharge or transfer. Comparing inlet and outlet flow can reveal retention, recycling, bypass, or operational differences.
Reuse flow
Reuse flow is important where treated water is used for gardening, flushing, cooling tower makeup, process reuse, or other internal applications.
A dashboard should clearly label each meter so reports are not confusing.
Pump and blower status
Flow tells what moved. Pump and blower status help explain why it moved.
Useful digital inputs:
- Inlet pump ON/OFF
- Transfer pump ON/OFF
- Filter feed pump ON/OFF
- Sludge pump ON/OFF
- Blower ON/OFF
- Panel healthy/fault status
Runtime data helps maintenance teams identify excessive starts, long idle periods, and equipment that is not operating as expected.
Quality parameters
Some sites also monitor quality parameters such as:
- pH
- TDS
- Turbidity
- Temperature
- Dissolved oxygen
- ORP
- Conductivity
Whether these are required depends on the plant, consent condition, and process need. If analyzers support Modbus, the same gateway can often collect those values along with flow data.
Reports for compliance and audits
A good dashboard should make reports easier, not create more work.
Useful reports include:
- Daily inlet/outlet flow summary
- Monthly cumulative flow
- Reuse quantity report
- Pump runtime report
- Device offline report
- Alarm history
- Missing data report
- Export to CSV/PDF
Reports should include site name, meter name, timestamp range, and units. For multi-site organizations, each site should have separate meter IDs and user access.
Alerts that matter
Recommended alerts:
| Alert | Possible issue |
|---|---|
| No flow during expected operating hours | Pump failure, blockage, plant not running |
| High inlet flow | Peak load, stormwater ingress, process upset |
| Outlet flow without inlet flow | Recycle, bypass, or measurement issue |
| Meter communication failure | RS485 wiring, meter power, gateway issue |
| Gateway offline | Power, SIM, antenna, or network problem |
| Tank high level | Pump failure or downstream blockage |
| Quality parameter out of range | Process issue requiring operator action |
| Long plant downtime | Compliance and operational risk |
Alerts should be sent to the person who can act on them, not only to management dashboards.
Local storage and network reliability
Many STP/ETP panels are in basements, utility rooms, or remote corners of a site. Mobile signal may be weak. The gateway should store data locally during network failure and upload later.
This prevents gaps in flow reports when the plant was running but the network was temporarily unavailable.
During installation, always test signal quality with the antenna in the final mounted position.
Commissioning checklist
Before handover, verify:
- Meter flow direction is correct.
- Dashboard flow rate matches meter display.
- Dashboard totalizer matches meter totalizer.
- Meter names clearly identify inlet, outlet, and reuse points.
- Pump status inputs match physical panel status.
- Gateway reconnects after power restart.
- Local buffering works during network loss.
- Alerts are tested.
- Daily/monthly reports export correctly.
- User roles are set for operator, manager, and admin access.
Which SilTech device should you use?
Use Flow Telemetry 4G when the requirement is compact flow meter telemetry for one or more water/effluent flow points.
Use BusLog 4G when the STP/ETP panel needs broader data logging: multiple Modbus meters, quality analyzers, pump status, level sensors, or integration with a cloud platform.
Explore SilTech’s Water & Flow Monitoring Solution for flow, level, pump, and compliance telemetry applications.
Final advice
STP and ETP monitoring should be designed for both reporting and real operations. Start with accurate flow and totalizer data, then add pump status, level, and quality parameters where needed. With 4G telemetry and local storage, the plant team gets continuous visibility without depending on manual readings alone.