You have 5 energy meters across a factory floor — main incomer, production block, utilities, HVAC, lighting. You want real-time kWh readings, demand peaks, and power factor data on a single dashboard. And you want it accessible remotely without running Ethernet to every panel.
This is a standard deployment scenario for the BusLog 4G. Here's how to set it up.
What You'll Need
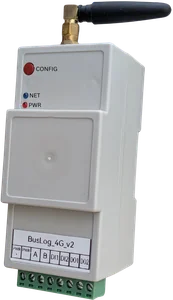
- BusLog 4G gateway (1 per site or panel group)
- Energy meters with Modbus RS485 output (Selec, Schneider, L&T, ABB, Havells — most mid-range meters have this)
- RS485 twisted pair cable (Belden 9841 or equivalent)
- 120Ω termination resistor
- 9–24V DC power supply for the BusLog
- SIM card (Airtel, Jio, Vi — BusLog auto-detects APN)
- Cloud platform or MQTT broker (ThingsBoard, AWS IoT, etc.)
Step 1: Set Unique Addresses on All Meters
Every Modbus device on the RS485 bus must have a unique slave address (1–247). Before wiring, configure each meter's address.
How: Most energy meters have a configuration menu on the front panel display. Navigate to Communication Settings and set: - Slave address: 1, 2, 3, 4, 5 (one per meter) - Baud rate: 9600 (recommended — works reliably over longer cable runs) - Parity: None
Write the address on a sticker and stick it on each meter. You'll need this during BusLog configuration.
Important: If you have meters of different models with factory default address 1, you must change them before connecting them to the shared bus — otherwise they'll all respond simultaneously and corrupt communication.
Step 2: Wire the RS485 Bus
Connect meters in a daisy chain — A to A, B to B, running from the BusLog through each meter in sequence.
[BusLog 4G]
    A ──────┬──────────────────────────────── A [Meter 5] ─── 120Ω
    B ──────┴──────────────────────────────── B [Meter 5]
            │ (cable passes through each meter)
         [Meter 1] → [Meter 2] → [Meter 3] → [Meter 4] → [Meter 5]
Cable routing tips: - Keep RS485 cable away from power cables — minimum 20cm separation - If cables must cross, cross at 90° - For panel installations, keep cables bundled on one side of the panel (away from busbars and contactors) - Total bus length for all 5 meters at 9600 baud: up to 1200m (more than enough for any single site)
Place a 120Ω resistor across A and B at the last meter (Meter 5 in this example).
Step 3: Power and Access the BusLog
Power the BusLog with 9–24V DC. Insert SIM card.
On first boot, the BusLog creates a WiFi access point:
- SSID: BusLog_AP-XXXXXX
- Password: refer to your device manual for default credentials
- Web UI: refer to your device manual for the default IP address
Connect to this AP from your laptop and open the web UI.
Step 4: Configure Each Energy Meter
In the BusLog web UI, go to Modbus Settings → Add Device for each meter.
If your meter model is in the Profile Library (Selec EM2M, EM2M-4G, Schneider PM1000/iEM series, ABB B-series, L&T WiZo): - Click Load Profile - Select manufacturer and model - All registers for voltage, current, power, power factor, frequency, kWh, kVAh are pre-loaded
If your meter is not in the library:
You'll need the Modbus register map from the meter's datasheet. Key registers for most energy meters:
| Parameter | Typical Register | Data Type |
|---|---|---|
| Voltage L1 (V) | 0x0000 | 32-bit float |
| Current L1 (A) | 0x0008 | 32-bit float |
| Active Power (kW) | 0x0012 | 32-bit float |
| Power Factor | 0x002A | 32-bit float |
| Frequency (Hz) | 0x0036 | 32-bit float |
| Active Energy (kWh) | 0x0100 | 32-bit float |
These are indicative — always verify against your specific meter's datasheet.
Repeat for all 5 meters, using the correct slave address for each.
Step 5: Set Upload Interval
Under Interval Settings, set your poll and upload interval.
Recommended for energy monitoring: - Poll interval: 1–5 minutes for real-time dashboards - 15 minutes for billing/reporting use cases - 30 minutes for trend analysis only
Data volume at 5-minute intervals: - 5 meters × 10 parameters × 288 readings/day = 14,400 data points/day - Approximately 5–10MB/day of cellular data — well within any standard SIM plan
Step 6: Configure Network
WiFi (if available at the panel): - Network Settings → WiFi → enter site SSID and password - BusLog uses WiFi as primary, falls back to 4G automatically
4G only (remote or outdoor panels): - SIM is auto-configured for most Indian operators - For custom APN: Network Settings → SIM → Manual APN
Step 7: Configure Cloud Destination
Generic MQTT (ThingsBoard, HiveMQ, Mosquitto):
- Broker: your MQTT broker hostname/IP
- Port: 1883 (or 8883 for TLS)
- Client ID, username, password
- Topic: siltech/site1/energy (or your naming convention)
The BusLog publishes a JSON payload containing all 5 meters' data in one message:
{
  "device_id": "BL-001",
  "timestamp": "2026-03-22T10:00:00Z",
  "devices": [
    {
      "id": "EM1", "name": "Main Incomer",
      "values": {"voltage": 231.2, "current": 45.3, "power": 10.4, "energy": 15420.6, "pf": 0.94}
    },
    {
      "id": "EM2", "name": "Production Block",
      "values": {"voltage": 230.8, "current": 28.1, "power": 6.3, "energy": 8210.4, "pf": 0.91}
    },
    {
      "id": "EM3", "name": "Utilities",
      "values": {"voltage": 231.0, "current": 12.4, "power": 2.7, "energy": 3140.2, "pf": 0.88}
    }
  ]
}
Standard JSON — parse it with any IoT platform, Node-RED, or custom backend.
Step 8: Build the Dashboard
In ThingsBoard (or your platform of choice), create:
Real-time widgets: - Power gauge for each meter (kW) — see current load at a glance - Current trend chart — last 24 hours - Power factor indicator — flag meters below 0.85
Historical widgets: - Energy (kWh) bar chart — daily/weekly/monthly consumption per meter - Peak demand chart — identify the daily demand peak time
Alarms: - Power factor below threshold → email/SMS alert - Demand exceeds contract limit → alert - Meter offline (no data for >10 minutes) → alert
Offline Data Protection
If the cellular connection drops (network outage, SIM issue), the BusLog stores readings locally in flash memory. When connectivity restores, all buffered data uploads automatically in chronological order.
For energy billing and compliance applications, this means your historical kWh data stays complete — no manual gap-filling.
Expanding the Installation
Need to add more meters later? Add them to the RS485 bus (extend the daisy chain, move the termination resistor to the new last device) and add the device configuration in the BusLog web UI. No hardware changes to the gateway needed.
The BusLog 4G supports up to 32 Modbus slave devices on a single RS485 bus.
Summary
Monitoring 5 energy meters over 4G requires: 1. Unique Modbus addresses on each meter 2. RS485 daisy chain wiring with 120Ω termination 3. BusLog configured with each meter's registers 4. WiFi or 4G network configured 5. MQTT/cloud destination configured 6. Dashboard built on your platform of choice
Total commissioning time for a 5-meter installation: 2–3 hours including wiring.
Need help with a multi-meter energy monitoring project? Contact us.