Water treatment plants and pump stations share a common problem: they're often unmanned, spread across large distances, and still rely on operator rounds for data collection. A pump trips at 2 AM, the sump overflows before anyone notices, and the maintenance log shows the fault only in the morning.
IoT monitoring doesn't require replacing your existing equipment. It puts eyes on every critical parameter — remotely, continuously — so problems get caught before they become failures.
What to Monitor in a Water Plant
The right monitoring parameters depend on the plant type. Here's a breakdown by application:
Sewage Treatment Plant (STP)
| Parameter | Why | Sensor / Interface |
|---|---|---|
| Pump run/stop status | Know when pumps are running vs tripped | Digital Input (contactor auxiliary) |
| Pump motor current | Detect overload, dry run, choking | Current meter → Modbus RS485 |
| Inlet/outlet flow rate | Treatment efficiency, billing | Flow meter pulse output → DI on BusLog |
| Sump level | Overflow prevention, pump scheduling | Level transmitter → Modbus or Analog |
| Blower run status | Aeration monitoring | Digital Input |
| Power consumption | Energy billing, anomaly detection | Energy meter → Modbus RS485 |
Water Treatment Plant (WTP)
| Parameter | Why | Sensor / Interface |
|---|---|---|
| Inlet/outlet flow | Production volume, efficiency | Flow meter |
| Pressure (pre/post filter) | Filter choking detection | Pressure transmitter → Modbus |
| Chlorine dosing pump status | Compliance monitoring | Digital Input |
| Chemical tank levels | Prevent dosing failures | Level sensor |
| Treated water turbidity | Quality monitoring | Turbidity sensor → Modbus |
| Energy per kL produced | Efficiency metric | Energy meter |
Remote Pump Station / Booster Station
| Parameter | Why | Sensor / Interface |
|---|---|---|
| Pump run/stop | Remote status | Digital Input |
| Suction and delivery pressure | Dry run detection, system health | Pressure transmitter |
| Flow rate | Volume delivered | Flow meter |
| Motor current | Bearing wear, overload | Energy meter |
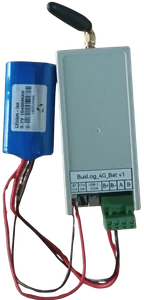
| Battery/power status (if off-grid) | Site power monitoring | BMS in BusLog 4G BAT |
Device Selection by Site Type
| Site Type | Recommended Gateway | Reason |
|---|---|---|
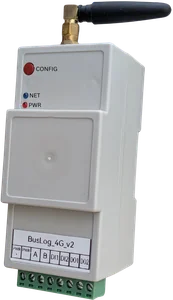
| Mains-powered STP/WTP | BusLog 4G or BusLog 4G | Always-on, multiple Modbus devices |
| Remote pump station (AC power) | BusLog 4G | Reliable, continuous polling |
| Remote pump station (no AC power) | BusLog 4G BAT + solar or BusLog 4G BAT | Battery-powered, deep sleep |
| Flow meter at remote site (no power) | BusLog 4G BAT | Counts pulses during deep sleep, 7+ year battery |
Typical STP Monitoring Setup
A mid-sized residential STP (50–500 KLD) typically has: - 2–4 sewage pumps - 1–2 blowers (for aeration) - 1 flow meter on the inlet - 1 energy meter on the main panel - Sump level sensor
Hardware: - 1× BusLog 4G (for Modbus RS485 + Digital Inputs) - Energy meter with Modbus RS485 (Selec EM2M or equivalent) - Flow meter with pulse output (connected to DI1 on BusLog) - Contactor auxiliary contacts for each pump (connected to DI2, DI3... on BusLog)
RS485 bus: Energy meter → BusLog (daisy chain, 120Ω termination at meter end)
Digital Inputs: - DI1: Flow meter pulse output (pulse counter mode) - DI2: Pump 1 run status (contactor auxiliary contact) - DI3: Pump 2 run status
Data uploaded to cloud every 5 minutes: - Energy consumption (kWh, kW, current, power factor) - Flow total and flow rate - Pump 1 and Pump 2 run status
Remote Pump Station: Battery-Powered Setup
For a pump station 20km from the nearest town with no Ethernet and unreliable grid power:
Hardware: - 1× BusLog 4G BAT (LTC D-cell battery, 5–7 year life) - Pressure transmitter with Modbus RS485 (suction and delivery) - Contactor auxiliary for pump run status → Digital Input
Upload schedule: Every 30 minutes (configurable). Pump status and pressures uploaded on each wake cycle. All data stored locally between cycles — zero data loss.
If you also need flow meter pulse counting: Use BusLog 4G BAT instead. It counts flow meter pulses during deep sleep — every pulse is counted even between 30-minute upload cycles, with negligible battery impact (~0.002 mAh per pulse).
Alarm Configuration
The real value of remote monitoring is not the dashboard — it's the alarms. Configure these as a minimum:
| Alarm | Condition | Action |
|---|---|---|
| Pump trip | Run status = 0 during operational hours | SMS + email to operator |
| Dry run | Current below minimum threshold while pump running | Immediate SMS — risk of pump damage |
| High sump level | Level > 85% | SMS alert — risk of overflow |
| Low flow | Flow rate drops below expected range | Alert — possible blockage |
| Power failure | Gateway goes offline (LWT) | SMS alert — site power down |
| Low power factor | PF < 0.85 | Weekly report — efficiency issue |
Platform recommendation for STP/WTP: ThingsBoard. Free self-hosted version handles alarm rules, email/SMS notifications (via integration), and multi-site dashboards. Widely used in Indian water utility deployments.
Data for Compliance Reporting
Many STPs are required to submit daily flow logs and treatment reports to the Pollution Control Board. With IoT monitoring:
- Automated daily report: total volume treated, average flow rate, pump run hours
- Historical data for inspection — show 30/60/90 day records on demand
- Export to CSV for submission
This eliminates the manual log compilation that typically takes a supervisor 1–2 hours per day across multiple sites.
Multi-Site Dashboard
For a water utility managing 10–20 pump stations or STPs:
One BusLog per site, all connecting to the same MQTT broker and ThingsBoard instance. Single dashboard shows all sites — status overview, alarms, trends.
Field example: A housing society with 3 STPs and 2 water tanks across a large campus. 5 BusLog gateways, one ThingsBoard server on a small cloud VM, 2 years of continuous monitoring. Maintenance team manages all 5 sites from a single phone dashboard, receives WhatsApp alerts on pump trips.
Getting Started: Minimum Viable Installation
For a single STP or pump station:
- Install one Selec EM2M energy meter on the main panel
- Install BusLog 4G in the same panel
- Wire RS485 from meter to BusLog
- Wire contactor auxiliary contacts to DI1, DI2 for pump run status
- Insert SIM, power on
- Configure via web UI: meter registers + DI modes + MQTT destination
- Set up free ThingsBoard account, create device, build basic dashboard
Time from hardware on-site to live data: 3–4 hours.
Summary
Water plant monitoring with IoT comes down to: - What to monitor: pumps, flow, energy, levels — start with the parameters that cause the most incidents - Right hardware: AC-powered gateway for panel installations; battery-powered for remote sites - Alarms: define the critical conditions before deployment, not after - Dashboard: start simple — run status, energy, flow. Add complexity as needed
Manual rounds catch problems after they've happened. IoT monitoring catches them before.
Planning an STP or water plant monitoring project? Talk to us — we've deployed across residential societies, industrial STPs, and municipal water utilities.