A 500 kW rooftop solar plant generating 10% below its expected output costs the owner ₹3–5 lakh per year in lost generation. The fault — a shaded string, a failed MPPT tracker, a soiled panel section — often goes undetected for months without monitoring.
Monitoring solar plants isn't about watching a dashboard. It's about catching performance deviations before they compound into significant losses.
This guide covers what data matters, what to ignore, and how to set up practical IoT monitoring on commercial and industrial solar plants using Modbus-capable inverters.
The Key Metrics — What Actually Matters
Most solar monitoring platforms show 20+ metrics per inverter. These are the ones that actually drive decisions:
1. Performance Ratio (PR)
What it is: Actual generation ÷ Expected generation (based on irradiance and plant capacity), expressed as a percentage.
Why it matters: PR is the single most important metric for plant health. A well-maintained plant should have a PR of 75–82%. If it drops below 70%, something is wrong.
What you need: Energy generated (kWh) from the inverter + irradiance data (from a pyranometer or irradiance sensor — or estimated from weather data as a simpler approach).
2. String Current (per MPPT input)
What it is: DC current from each string of solar panels connected to the inverter.
Why it matters: Strings with shading, soiling, or failed panels show lower current than healthy strings. On a 500 kW plant with 20 strings, one failed string at 25 panels × 10A = 250W reduction per string — invisible in the total output figure but visible when you compare string currents.
What you need: Inverters that report per-string current via Modbus (most commercial inverters do). Alternatively, DC string combiners with current monitoring.
3. Inverter AC Output Power
What it is: Real power output from the inverter in kW.
Why it matters: Sudden drops or clipping (output capped at rated power during peak irradiance) are immediately visible. Compare across multiple inverters on the same plant — an underperforming inverter stands out.
4. DC/AC Conversion Efficiency
What it is: AC output ÷ DC input, expressed as a percentage.
Why it matters: Healthy inverters operate at 96–98% efficiency. An inverter dropping to 90% efficiency is wasting 6–8% of your generation — and probably about to fail.
5. Inverter Temperature
What it is: Internal heatsink or ambient temperature reported by the inverter.
Why it matters: Overheating is the primary cause of inverter failure. An inverter running hot (>70°C ambient) indicates inadequate ventilation, blocked heatsink, or a cooling fan failure. Catching this early prevents a ₹2–10 lakh replacement.
6. Grid Parameters (for grid-tied plants)
- Grid voltage (should stay within ±10% of nominal 415V/230V)
- Grid frequency (49.5–50.5 Hz for normal operation)
- Power factor
Grid events — under-voltage, over-frequency, grid failures — trigger inverter trip. Knowing when and how often this happens is important for plant O&M.
What You Can Ignore (For Most Plants)
- Instantaneous irradiance — useful for academic analysis, overkill for most O&M
- Module temperature — relevant for detailed energy yield modelling, not for daily operations
- Individual panel data — module-level monitoring requires microinverters or power optimisers; not applicable to standard string inverter plants
- Reactive power / VAR — relevant only for grid compliance at utility scale
Inverter Modbus RS485 Support
Most commercial solar inverters support Modbus RTU over RS485 for data logging. Commonly deployed in India:
| Brand | Modbus RTU RS485 | Profile availability |
|---|---|---|
| Sungrow | ✅ | Available |
| Growatt | ✅ | Available |
| SMA | ✅ | Available |
| Delta | ✅ | Available |
| Huawei/iSolarCloud | ✅ (RS485 + Ethernet) | Available |
| ABB/FIMER | ✅ | Available |
| Ginlong / Solis | ✅ | Available |
Check your inverter datasheet for the RS485 communication port (usually a 3-pin or 5-pin connector labelled COM or RS485) and the Modbus register map document.
Important: Some inverter brands require a specific tool or setting to enable Modbus communication. Check the inverter manual — there's often a communication enable toggle in the installer menu.
Typical Plant Architecture
Small rooftop (50–200 kW), 2–5 inverters:
[Inverter 1] ─┐
[Inverter 2] ─┤── RS485 bus ── [BusLog 4G] ── 4G LTE ── Cloud
[Inverter 3] ─┘
One BusLog per roof section. Set a unique Modbus address on each inverter (default is usually address 1 on all of them — you must change them before connecting to the shared bus).
Large ground mount or industrial rooftop (200 kW–5 MW), 10+ inverters:
Multiple RS485 buses (up to 32 inverters per bus), each with a BusLog. All BusLogs connect to the same MQTT broker and cloud dashboard.
BusLog Configuration for Solar Inverters
-
Set inverter addresses: Configure each inverter with a unique Modbus slave address (1, 2, 3...) via the inverter's configuration menu.
-
Wire RS485 bus: Daisy chain from BusLog through each inverter. 120Ω termination at the last inverter.
-
Load inverter profile: In the BusLog web UI, go to Modbus Settings → Load Profile → select your inverter brand and model. The key registers (AC power, DC voltage/current per MPPT, energy, temperature, status) are pre-configured.
-
Set poll interval: 5 minutes is appropriate for solar monitoring — matches the resolution of most yield analysis tools.
-
Configure upload: MQTT to your monitoring platform. SolarEdge, Locus Energy, Solarman, or a general IoT platform like ThingsBoard.
Key Alarms to Configure
| Alarm | Condition | Response |
|---|---|---|
| Inverter offline | No data from inverter | Immediate check — inverter trip or comms failure |
| Low PR | PR < 70% for 3 consecutive days | Inspect panels, check strings |
| String current imbalance | One string >15% below average | Inspect that string — shade, soiling, or panel fault |
| Inverter temperature high | Heatsink temp > 70°C | Check ventilation, clean heatsink |
| Grid fault | Inverter reports grid fault event | Check grid supply, check inverter trip log |
| Zero generation during daylight | AC output = 0 during 10am–3pm | Immediate — inverter offline or grid fault |
| Under-performance vs yesterday | Generation >20% below same day last month | Soiling inspection if irradiance is normal |
Remote Sites: Battery-Powered Monitoring
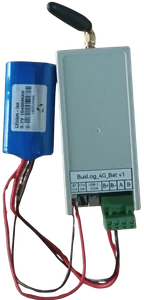
For ground-mount plants in rural locations with unreliable grid power at the monitoring location (not the inverter — the inverter has its own power), the BusLog 4G BAT is appropriate.
Deep sleep between upload cycles (configurable: 15 minutes to several hours), 5–7 year battery life, WiFi + 4G. The inverter's RS485 port is polled on each wake cycle.
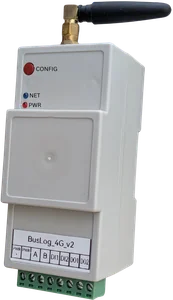
If the site has any AC power available (even the inverter AC output), use the standard BusLog 4G — always-on is better for solar monitoring where you want real-time generation data.
What Good Solar Monitoring Looks Like
After 30 days of monitoring on a 300 kW plant, you should be able to answer:
- What is the daily and monthly generation (kWh)?
- What is the plant PR — is it trending up or down?
- Which inverter is underperforming and by how much?
- How many grid fault events occurred this month?
- What time of day does peak generation occur?
- Is there a soiling pattern — does generation improve after rainfall?
If your monitoring can't answer these questions, you're collecting data but not using it.
Summary
For practical solar plant monitoring:
- Monitor PR — it tells you plant health in one number
- Monitor string currents — it tells you where the problem is
- Set alarms — zero generation, temperature, string imbalance
- Use Modbus RS485 — it's standard on almost every commercial inverter
- One BusLog per inverter group — scales cleanly from 50 kW to several MW
The goal isn't a dashboard with 50 metrics. It's knowing within 15 minutes when something goes wrong — and having enough data to know what and why.
Setting up monitoring on a solar plant? Contact us — we'll help with register maps and inverter-specific configuration.