Most factory floors still run on manual logbooks. An operator walks the floor every 2 hours, writes down meter readings, notes which machines ran and for how long, flags anything that looked abnormal. It works — until it doesn't.
The logbook misses the compressor that tripped at 3 AM and restarted on its own. It misses the gradual current rise on Motor 4 that's been trending upward for three weeks. It misses the hour of idle run on the CNC machine that nobody noticed.
IoT monitoring doesn't replace your operators. It gives them data they couldn't collect manually.
What to Monitor on Factory Machines
Before picking hardware, define what you actually need to know. The most useful monitoring parameters for factory machines:
| Parameter | Why it matters | Sensor/Interface |
|---|---|---|
| Energy consumption (kWh) | Cost allocation, idle detection, anomaly detection | Energy meter → Modbus RS485 |
| Machine run/stop status | OEE calculation, shift reporting | Digital Input (DI) on BusLog |
| Motor current | Overload detection, bearing wear trend | Current meter → Modbus RS485 |
| Temperature | Overheating alerts, process quality | SenseBus TH or thermocouple transmitter → Modbus |
| Vibration | Predictive maintenance | Vibration transmitter → Modbus or Analog Input |
| Cycle count | Production count, OEE | Pulse output → Digital Input on BusLog |
| Coolant pressure/flow | CNC machine health | Pressure transmitter → Analog/Modbus |
Start with energy and run status. These two give you 80% of the insight for the least cost.
Architecture: One Gateway per Panel
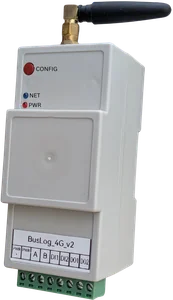
The cleanest way to deploy factory monitoring is to install one BusLog gateway per electrical panel or machine group.
[Machine 1 Energy Meter] ─┐
[Machine 2 Energy Meter] ─┤── RS485 bus ── [BusLog 4G] ── WiFi/4G ── Cloud
[Machine 3 Energy Meter] ─┘
        ↑
[Run/Stop relay → DI1, DI2]
Why per panel: - Shorter RS485 runs = more reliable communication - Easier troubleshooting — one gateway failure affects one panel, not the whole floor - Panel installation is clean — gateway mounts on DIN rail inside the panel
For a factory with 3 panels, you'd have 3 gateways. Each uploads independently to the same cloud account. Your dashboard shows all machines together.
Step 1: Energy Monitoring Setup
Install an energy meter with Modbus RS485 output on each machine feeder. Popular options:
- Selec EM2M — affordable, reliable Modbus energy meter
- Schneider iEM3110 — mid-range, accurate
- L&T WiZo — widely available in India
Wire all meters in RS485 daisy chain to the BusLog. Each meter gets a unique Modbus slave address (set via the meter's configuration).
In the BusLog web UI, load the profile for your meter model. The register map is pre-built — voltage, current, power, power factor, energy (kWh) are all configured automatically.
Key registers to log: - Active power (kW) — real-time load - Energy (kWh) — cumulative consumption - Current (A) — motor load indicator - Power factor — efficiency indicator
Step 2: Run/Stop Status via Digital Input
Knowing when a machine is actually running versus sitting idle is as important as energy data.
Method 1: Auxiliary contact on contactor The main contactor for each machine has an auxiliary contact — a small relay that closes when the contactor energizes. Wire this to a Digital Input on the BusLog 4G.
- DI state = 1 → machine running
- DI state = 0 → machine stopped
Method 2: Current threshold If you already have an energy meter installed, you can derive run status from current — if current exceeds a threshold (e.g., 2A), the machine is running. Set this up in your dashboard logic.
Method 2 is simpler but less reliable for machines with variable loads that may drop below threshold during idle cycles. Method 1 (auxiliary contact) is the clean solution.
Step 3: Production Counting
Many machines have a pulse output — a reed switch or proximity sensor that fires once per cycle, once per part, or once per stroke.
Wire this to a Digital Input on the BusLog 4G, configured in Pulse Counter mode. The BusLog counts pulses between uploads and sends the total with each data payload.
On your dashboard: production count per hour, per shift, per day. OEE numerator — automatic.
What the Data Looks Like in Practice
After a week of monitoring a typical SME factory floor, you typically find:
Energy surprises: - 2–3 machines consuming 15–25% of their rated power while "idle" (air compressors cycling unnecessarily, spindles running without load) - One machine with significantly higher energy per cycle than the others — worth investigating
Run time surprises: - Actual productive run time is 60–70% of shift time on average — worse than most plant managers expect - Significant idle time between shifts where compressors and chillers stay on unnecessarily
Maintenance signals: - One motor's current trending upward by 8% over 3 weeks — bearing starting to fail - Occasional overcurrent spikes on a CNC machine that nobody had reported
None of this is visible in a manual logbook.
Dashboard Setup
The BusLog sends standard JSON to any MQTT broker or cloud platform. Recommended options:
ThingsBoard (free self-hosted or cloud): - Drag-and-drop dashboard widgets - Real-time gauges, trend charts, tables - Alarm rules with email/SMS notification - Good for SME factories without a dedicated IT team
AWS IoT + Grafana: - More powerful, more setup - Better for multi-site enterprise deployments
Node-RED + InfluxDB + Grafana: - Full control, open source - Best for teams with technical capacity
For most factory floors: ThingsBoard hits the right balance of capability and ease of use.
ROI: What to Expect
Conservative estimates from typical SME factory deployments:
| Source | Typical Saving |
|---|---|
| Eliminating unnecessary idle run | 5–10% energy reduction |
| Compressed air leak detection via pressure monitoring | 10–15% compressor energy |
| Identifying highest-energy processes for optimization | 8–12% overall |
| Preventing one unplanned motor failure per year | ₹50,000–2,00,000 per incident |
The monitoring hardware pays for itself in energy savings alone, typically within 6–12 months.
Getting Started: Minimum Viable Setup
If you want to start with one machine before committing to the full floor:
- Install one Selec EM2M energy meter on your highest-consumption machine
- Install one BusLog 4G in the panel
- Wire RS485, insert SIM, configure via web UI
- Set up a free ThingsBoard account
- You have live energy data within a few hours
Add more meters to the same RS485 bus as you expand. One BusLog supports up to 32 devices.
Want help scoping a monitoring project for your factory? Talk to us — we've done this across manufacturing, pharma, food processing, and packaging plants.